Snapshot taken August 11, 2026. We track 98,011 live and recently-active Meta ads from 2,025 DTC and B2C brands. The winners get hand-tagged against a 40-hook, 50-angle taxonomy — 69,999 ads carry a hook tag, 67,202 an angle tag. Run-time uses Meta's own ad start date where available. Curated, not scraped.
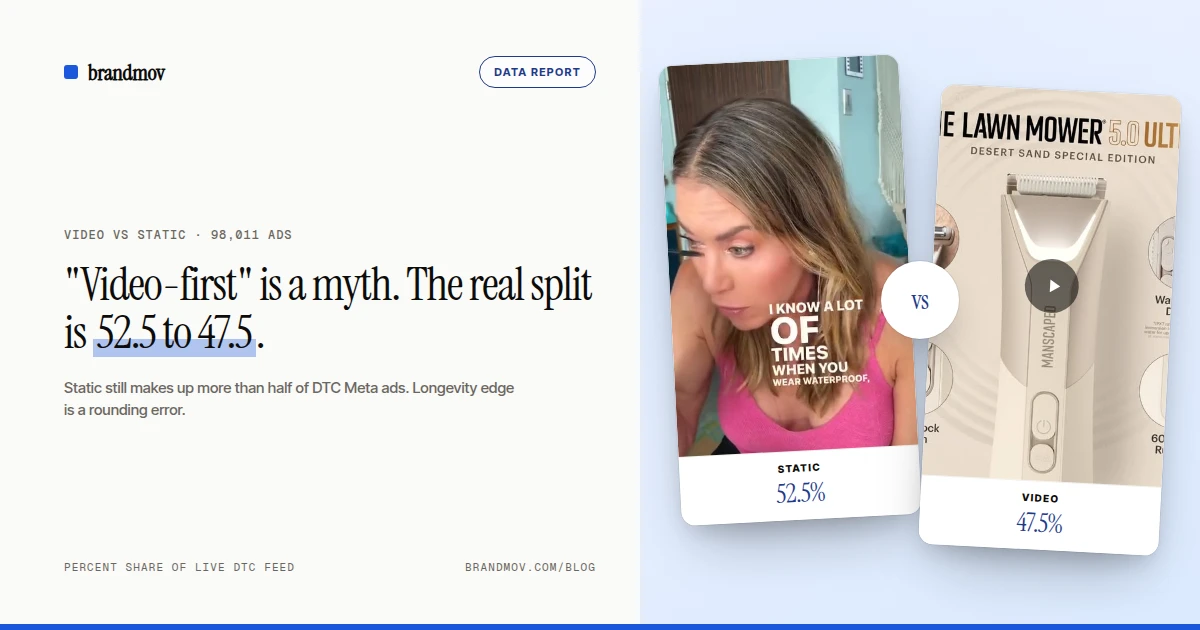
You've been told video won. Every agency deck, every LinkedIn guru: "video-first or die." We counted 98,011 real DTC Meta ads and the consensus falls apart on contact. Video is 47.5% of the feed. Static and image ads are the majority at 52.5%. The camera didn't win. It's a coin flip — and which side comes up depends entirely on what you sell.
The split swings hard by sector
Food, beauty, pets, wellness, and skincare are genuinely video-led (52–56%). But apparel and accessories are static strongholds — barely a third of their ads use video (36% and 37%). If you sell apparel and someone told you to go video-first, you're being coached to fight the market instead of reading it.
| Sector | % video | Video ads | Static ads |
|---|---|---|---|
| Food | 56% | 4,448 | 3,506 |
| Beauty | 54% | 6,956 | 5,818 |
| Pets | 54% | 2,163 | 1,852 |
| Wellness | 53% | 5,230 | 4,583 |
| Skincare | 52% | 3,721 | 3,408 |
| Baby | 50% | 1,925 | 1,939 |
| Home | 47% | 4,739 | 5,385 |
| Fitness | 46% | 2,470 | 2,877 |
| Accessories | 37% | 3,541 | 6,046 |
| Apparel | 36% | 6,209 | 11,128 |
Here's what 500 DTC brands are running this week
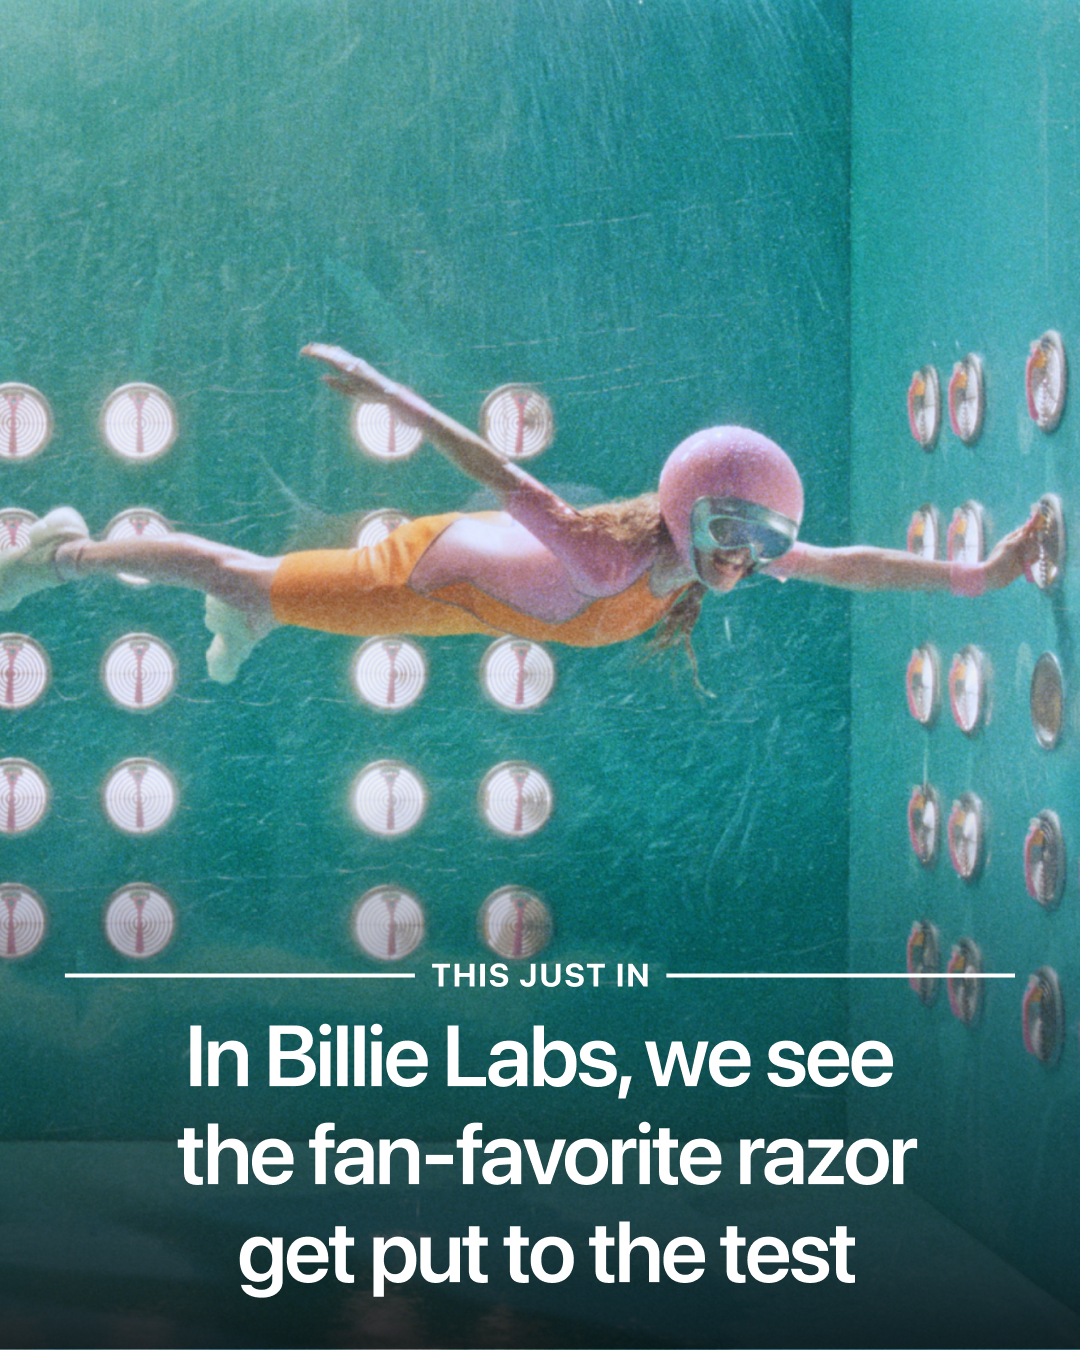
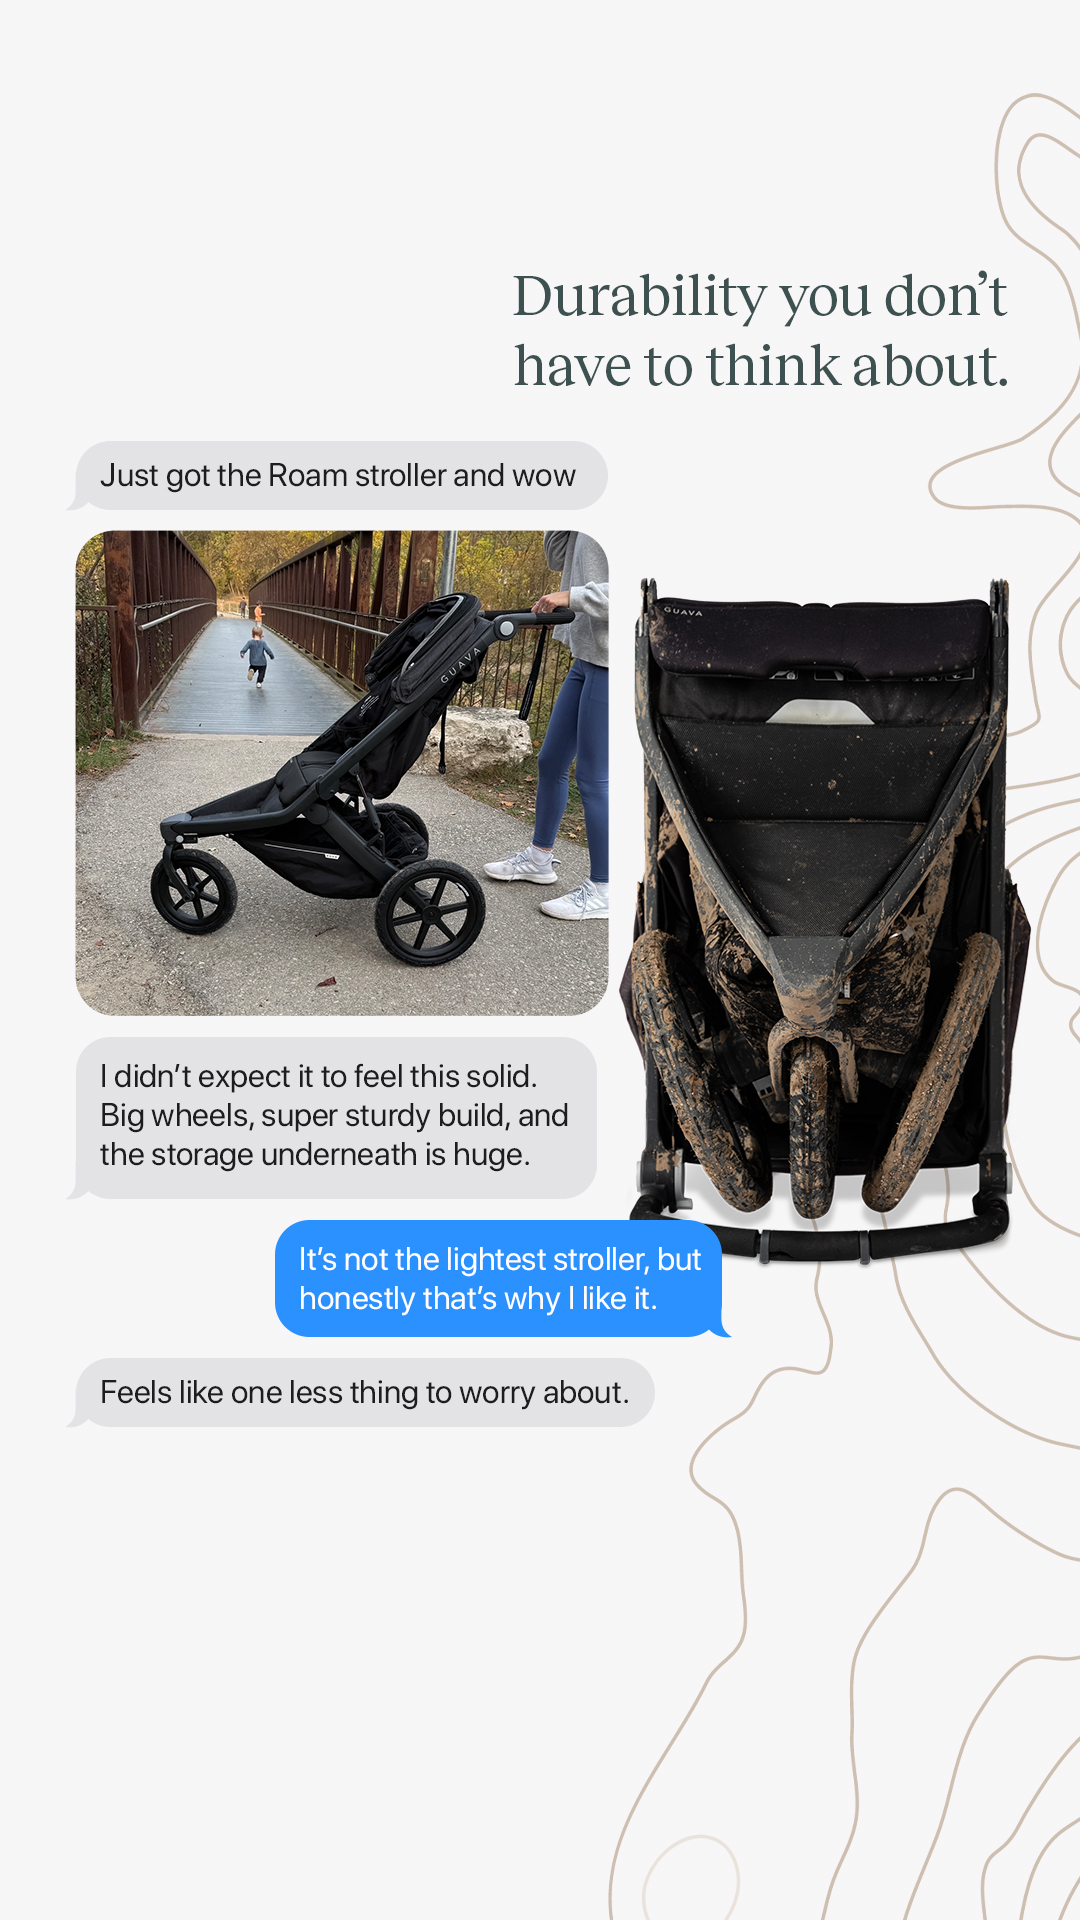
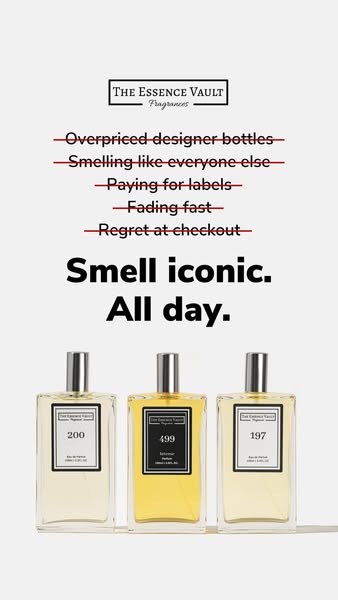
A small slice of the curated swipe file — every ad here is currently in market, hand-tagged by hook + angle. Open the full feed →



Video barely outlives static
Does video earn its production cost with longer runs? Barely. Video ads have a median run of 19 days versus 17 for static — a two-day edge for something that costs 10× the time to produce, and it has narrowed since our last snapshot. The volume math often favors static: you can ship five image variants in the time one video takes to cut, and test your way to a winner faster.
The honest rule: format is a sector decision, not a commandment. Match the category norm, then win on hook and angle. If you're in apparel or accessories, static isn't a compromise — it's what the survivors run. Every ad in the swipe file is tagged by format, hook, and angle, so you can see exactly what's working in your sector. Filter the feed → (or study the static-ad teardowns).