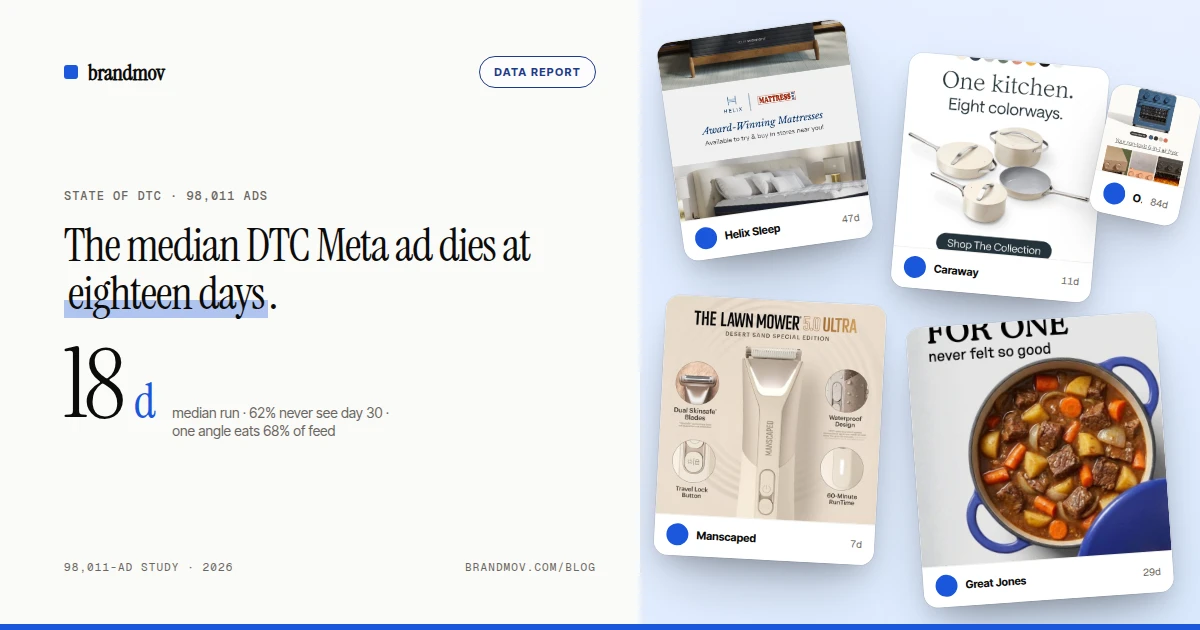
Snapshot taken August 11, 2026. We track 98,011 live and recently-active Meta ads from 2,025 DTC and B2C brands. The winners get hand-tagged against a 40-hook, 50-angle taxonomy — 69,999 ads carry a hook tag, 67,202 an angle tag. Run-time uses Meta's own ad start date where available. Curated, not scraped.
Open Meta's Ad Library and you'll drown. Millions of ads, no labels, no scores, no way to tell the winner from the corpse. So we did the unglamorous thing: we track 98,011 live ads from 2,025 DTC brands, and we hand-tag the winners. Here's what the raw pile actually looks like once you count it — and why scrolling it yourself is a losing game.
Most ads are already dead. You just can't tell which.
Here's the number that should change how you research: the median DTC Meta ad runs just 18 days. A quarter die inside six. Sixty-two percent are switched off before day 30. Only 664 ads — seven-tenths of one percent of everything we track — survive a full year. The ad library isn't a gallery of winners. It's a graveyard with a few survivors buried in it.
Why this wrecks manual research: when you scroll the raw Ad Library, you can't see run-time. That gorgeous ad you're about to copy? Two-to-one odds it was dead within a month. The swipe file only shows you ads that cleared the filter — hand-picked, hand-tagged, and scored on how long they actually survived. See what survived this week →
| How long ads run | Ads | Share of feed |
|---|---|---|
| Under 30 days (dead on arrival) | 60,930 | 62.2% |
| 30–90 days | 26,045 | 26.6% |
| 90–180 days | 7,816 | 8.0% |
| 180–365 days | 2,556 | 2.6% |
| 365+ days (proven winners) | 664 | 0.7% |
The feed is a monoculture
It gets worse. Of the 67,202 ads we've hand-tagged for angle, a single persuasion play — the benefit stack (rattle off what the product does) — carries 68% of them. And 78% of the entire corpus uses the exact same call-to-action: "Shop now." Everyone is making the same argument, the same way, with the same button. The scroll has been trained to ignore all of it.
That monoculture is your opening. When 68% of competitors run the identical angle, looking different is cheap — if you know which ads broke the pattern and survived. That's the entire job of the hand-tagged swipe file: surface the outliers, tag why they work, link you to the live creative. Browse the tagged feed →
Here's what 500 DTC brands are running this week
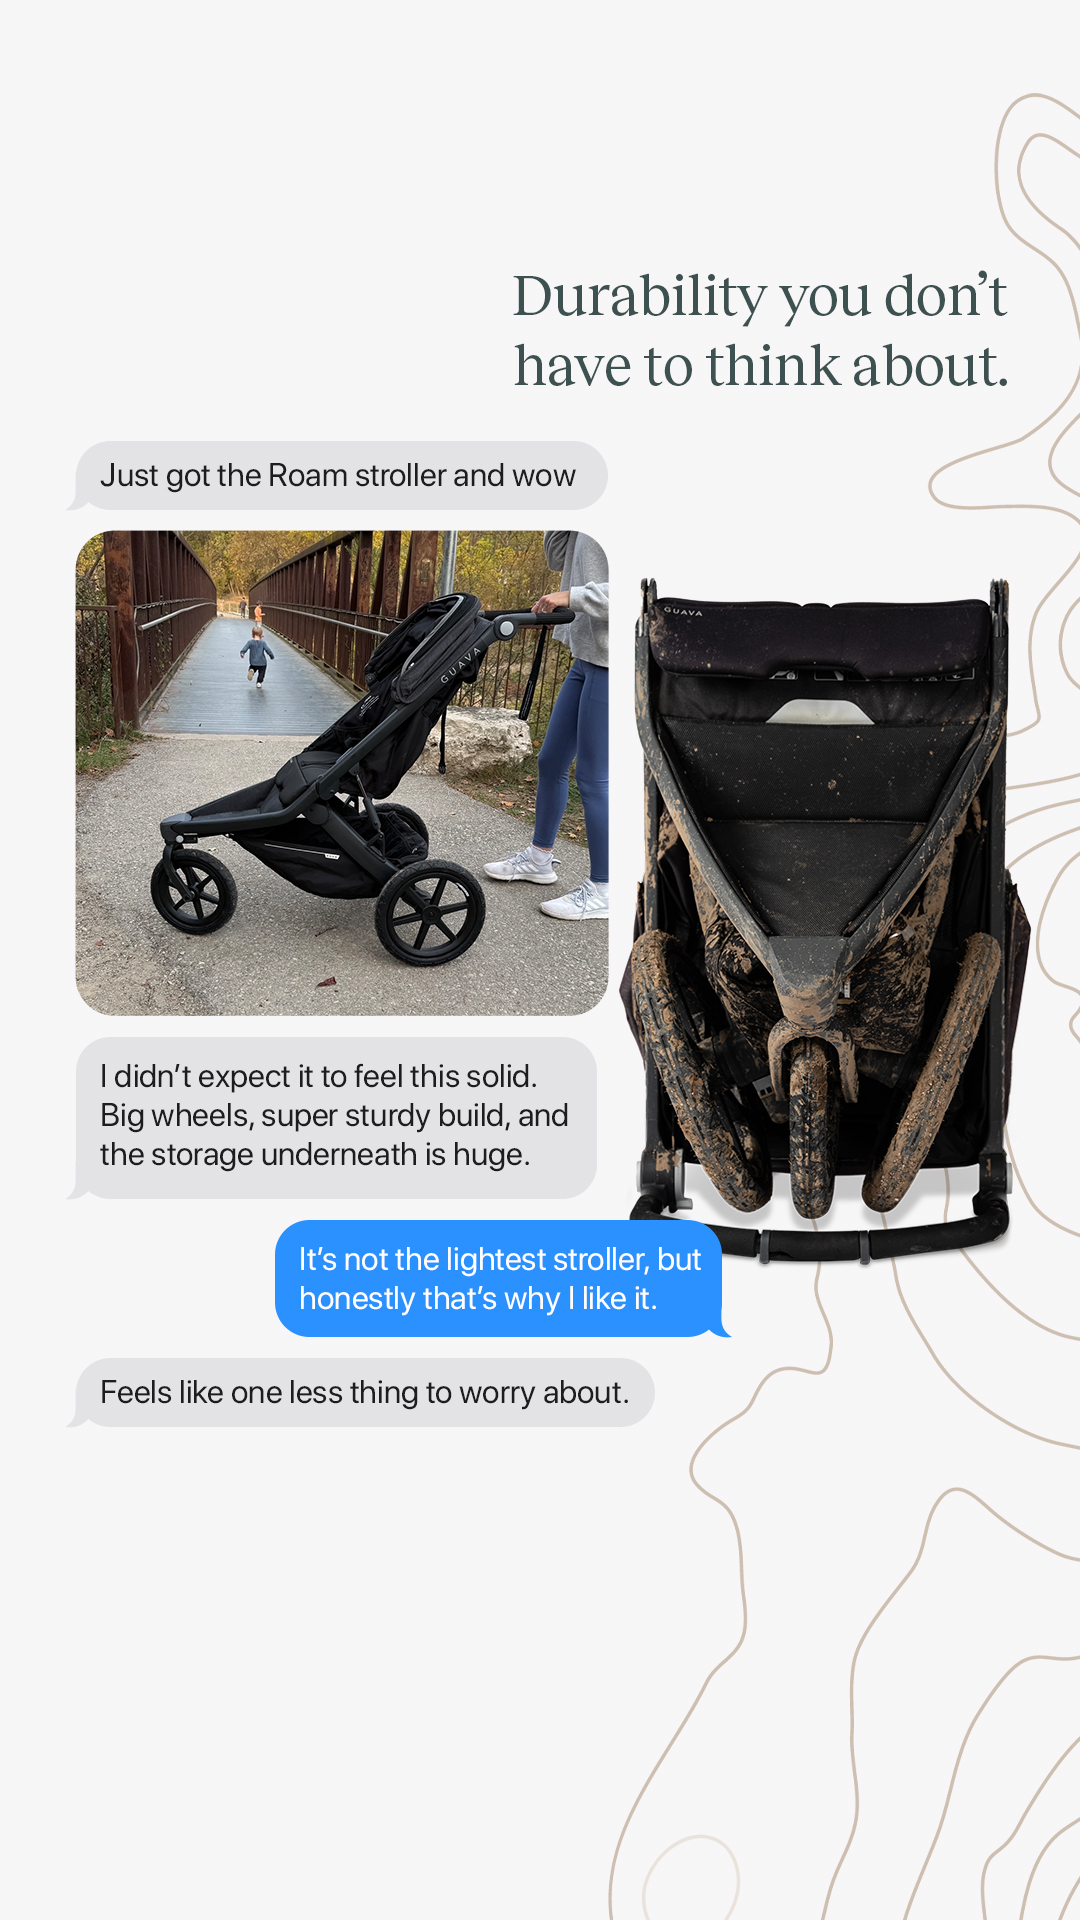
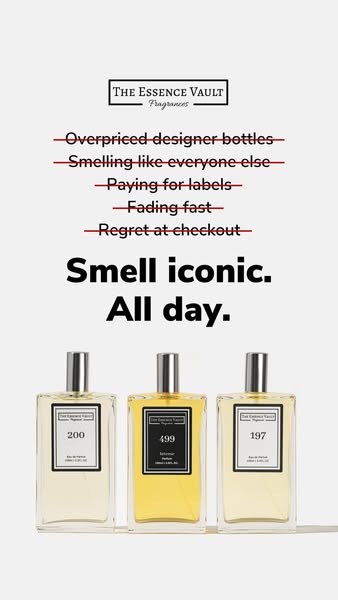
A small slice of the curated swipe file — every ad here is currently in market, hand-tagged by hook + angle. Open the full feed →




Where the ads come from
Apparel is the loudest category by a mile — over 17,000 ads from 319 brands, nearly a fifth of everything we track. Beauty, home, wellness, and accessories round out the top five. But volume isn't quality: apparel also churns its ads faster than almost anyone (more on that in the longevity report).
| Sector | Ads tracked | Brands | % video |
|---|---|---|---|
| Apparel | 17,337 | 319 | 36% |
| Beauty | 12,774 | 280 | 54% |
| Home | 10,124 | 207 | 47% |
| Wellness | 9,813 | 210 | 53% |
| Accessories | 9,587 | 173 | 37% |
| Food | 7,954 | 206 | 56% |
| Skincare | 7,129 | 155 | 52% |
| Fitness | 5,347 | 113 | 46% |
The one-line takeaway
The raw Ad Library is 98,011 ads of mostly-dead, mostly-identical creative with no labels. Reading it by hand is how you copy a loser and call it research. The alternative is a feed where every ad is hand-picked, hand-tagged by hook and angle, and scored on survival — the winners, isolated from the noise.
Stop scrolling graveyards. The BrandMov swipe file is the 98,011 ads above, filtered down to the ones that actually worked — tagged, scored, and linked to the live creative. Curated, not scraped. Open the feed →