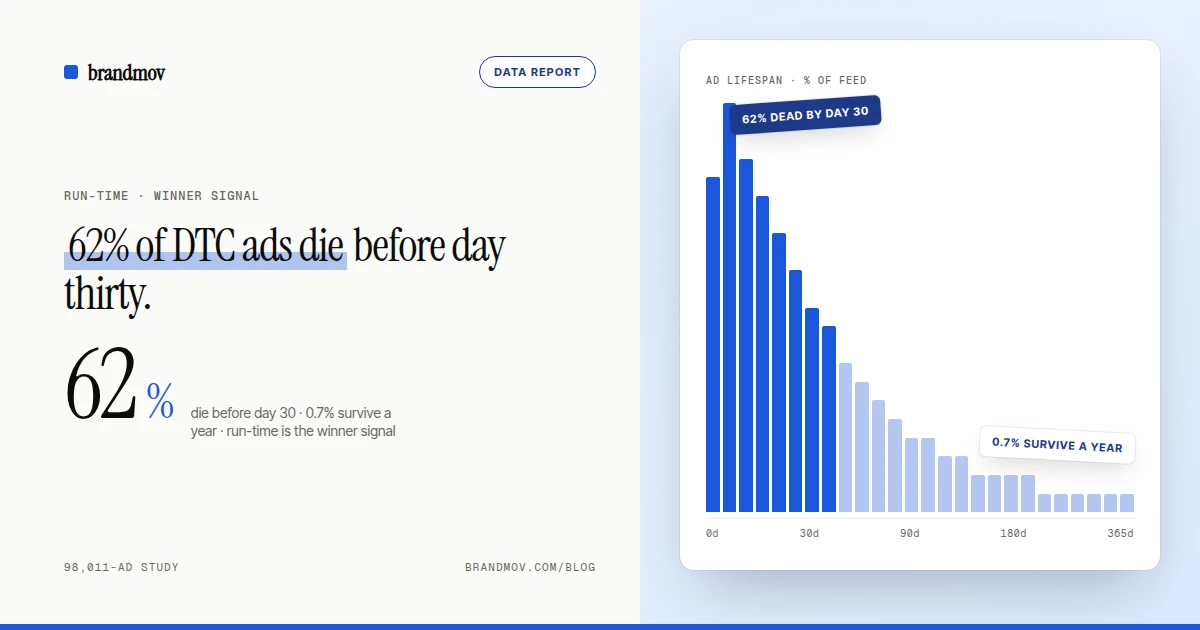
Snapshot taken August 11, 2026. We track 98,011 live and recently-active Meta ads from 2,025 DTC and B2C brands. The winners get hand-tagged against a 40-hook, 50-angle taxonomy — 69,999 ads carry a hook tag, 67,202 an angle tag. Run-time uses Meta's own ad start date where available. Curated, not scraped.
On Meta, ad longevity isn't vanity — it's a confession. Brands kill losers in days and ride winners for as long as they keep converting. So the length of time an ad has been live is the closest thing to a public confidence score a competitor will ever give you. We measured it across 98,011 DTC ads. The distribution is savage.
The survival curve falls off a cliff
Nearly two-thirds of everything — 60,930 of 98,011 ads — is switched off before day 30. By 90 days you're down to roughly one ad in nine. A full year is functionally the elite tier: just 664 ads, 0.7% of the corpus, have run continuously for 365 days or more. Those 664 are the ads that print money. Everything else is a test that failed.
| Run length | Ads | Share | Still surviving |
|---|---|---|---|
| Under 30 days | 60,930 | 62.2% | 37.8% |
| 30–90 days | 26,045 | 26.6% | 11.3% |
| 90–180 days | 7,816 | 8.0% | 3.3% |
| 180–365 days | 2,556 | 2.6% | 0.7% |
| 365+ days | 664 | 0.7% | — |
The move: when you spot a competitor ad that's been live 90+ days, stop everything. You're looking at a top-10% survivor — a creative that's earned its budget for a straight quarter. That is the single highest-signal thing you can steal in advertising. The catch: the raw Ad Library won't tell you an ad's run-time. The swipe file's run-length filter does — it's built on exactly this data.
Here's what 500 DTC brands are running this week
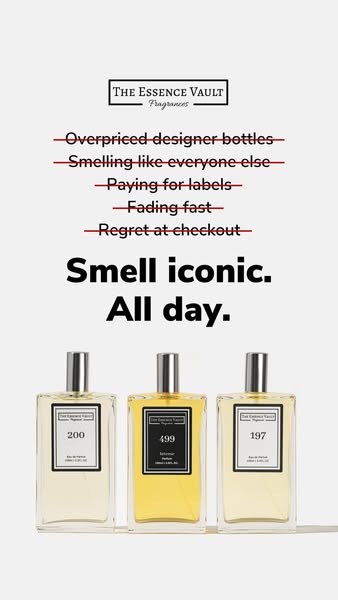
A small slice of the curated swipe file — every ad here is currently in market, hand-tagged by hook + angle. Open the full feed →





The sectors that endure aren't the ones you'd bet on
Here's the twist. Among the high-volume sectors, home and pets keep their ads live longest — a 24-day median, and a 90th percentile past 97 days. The fashion-led and consumable categories burn fastest: apparel, food, and skincare all sit at a median of 14. Apparel ships more ads than anyone and keeps each one live the shortest. Fast fashion, faster creative death.
| Sector | Median run | 90th pct | Ads |
|---|---|---|---|
| Home | 24 days | 108 days | 10,124 |
| Pets | 24 days | 97 days | 4,015 |
| Baby | 21 days | 97 days | 3,864 |
| Fitness | 20 days | 99 days | 5,347 |
| Wellness | 19 days | 93 days | 9,813 |
| Beauty | 17 days | 95 days | 12,774 |
| Accessories | 15 days | 87 days | 9,587 |
| Apparel | 14 days | 81 days | 17,337 |
| Food | 14 days | 90 days | 7,954 |
| Skincare | 14 days | 92 days | 7,129 |
Smaller categories swing wildly on thin samples and we've kept them out of the headline table: sleep runs a 27-day median with a 246-day 90th percentile, jewelry a 167-day 90th percentile — but coffee sits at a 6-day median. All of them are a few hundred ads from under fifteen brands.
Benchmark against your own sector, not a blog's round number. In home or pets, a 3-week-old ad is barely warmed up. In apparel or skincare, a 3-week-old ad is already above median. Either way, the ads worth copying are the survivors — and finding them by hand across 98,011 ads is a job you'll lose.
Skip the graveyard. The swipe file is pre-filtered to long-runners, hand-tagged by hook and angle, and refreshed weekly. Sort by run-length and you're looking at proven winners in seconds instead of scrolling dead ads for an afternoon. Open the feed →