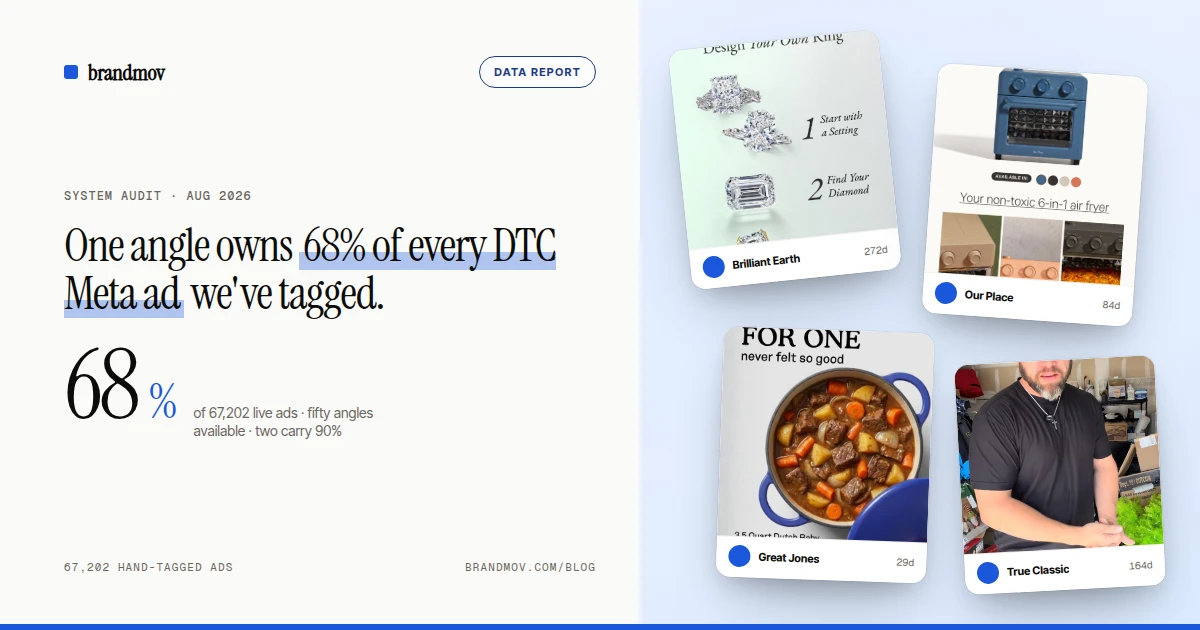
98,011 live and recently-active Meta ads from 2,025 DTC and B2C brands. Winners are hand-tagged on a 40-hook, 50-angle taxonomy; 69,999 carry a hook tag and 67,202 an angle tag. Video-vs-static split is counted from ad-creative media type. Longevity numbers come from our run-time tracker. Curated, not scraped raw.
The DTC feed feels the same because it is. We hand-tagged 67,202 live Meta ads on fifty different persuasion angles. Two of them carry ninety percent of the output. Every clever template swap, every UGC pivot, every new hook is happening on top of one identical argument.
Here is what 98,011 live ads across 2,025 brands actually say when you count. Three findings, in the order that should change what you ship next week.
The argument you are making is one of two
Fifty persuasion angles in the taxonomy. Six clear five hundred ads. Two carry the entire feed.
The benefit stack — a list of what the product does for the buyer — is the play in 45,415 of 67,202 tagged ads. That is 67.6%. Feature breakdown, the same argument in specification form, takes another 22.2%. Ninety percent of DTC creative is arguing the same two ways.
This is the thing your creative director keeps trying to describe. It is not a template problem. It is an argument problem. Rotating templates while making the same argument is what got the account here.
| Angle | Ads | Share |
|---|---|---|
| Benefit stack | 45,415 | 67.6% |
| Feature breakdown | 14,932 | 22.2% |
| Local promo | 1,624 | 2.4% |
| Social proof | 1,089 | 1.6% |
| Personal testimonial | 1,027 | 1.5% |
| Everything else (45 angles) | 3,115 | 4.7% |
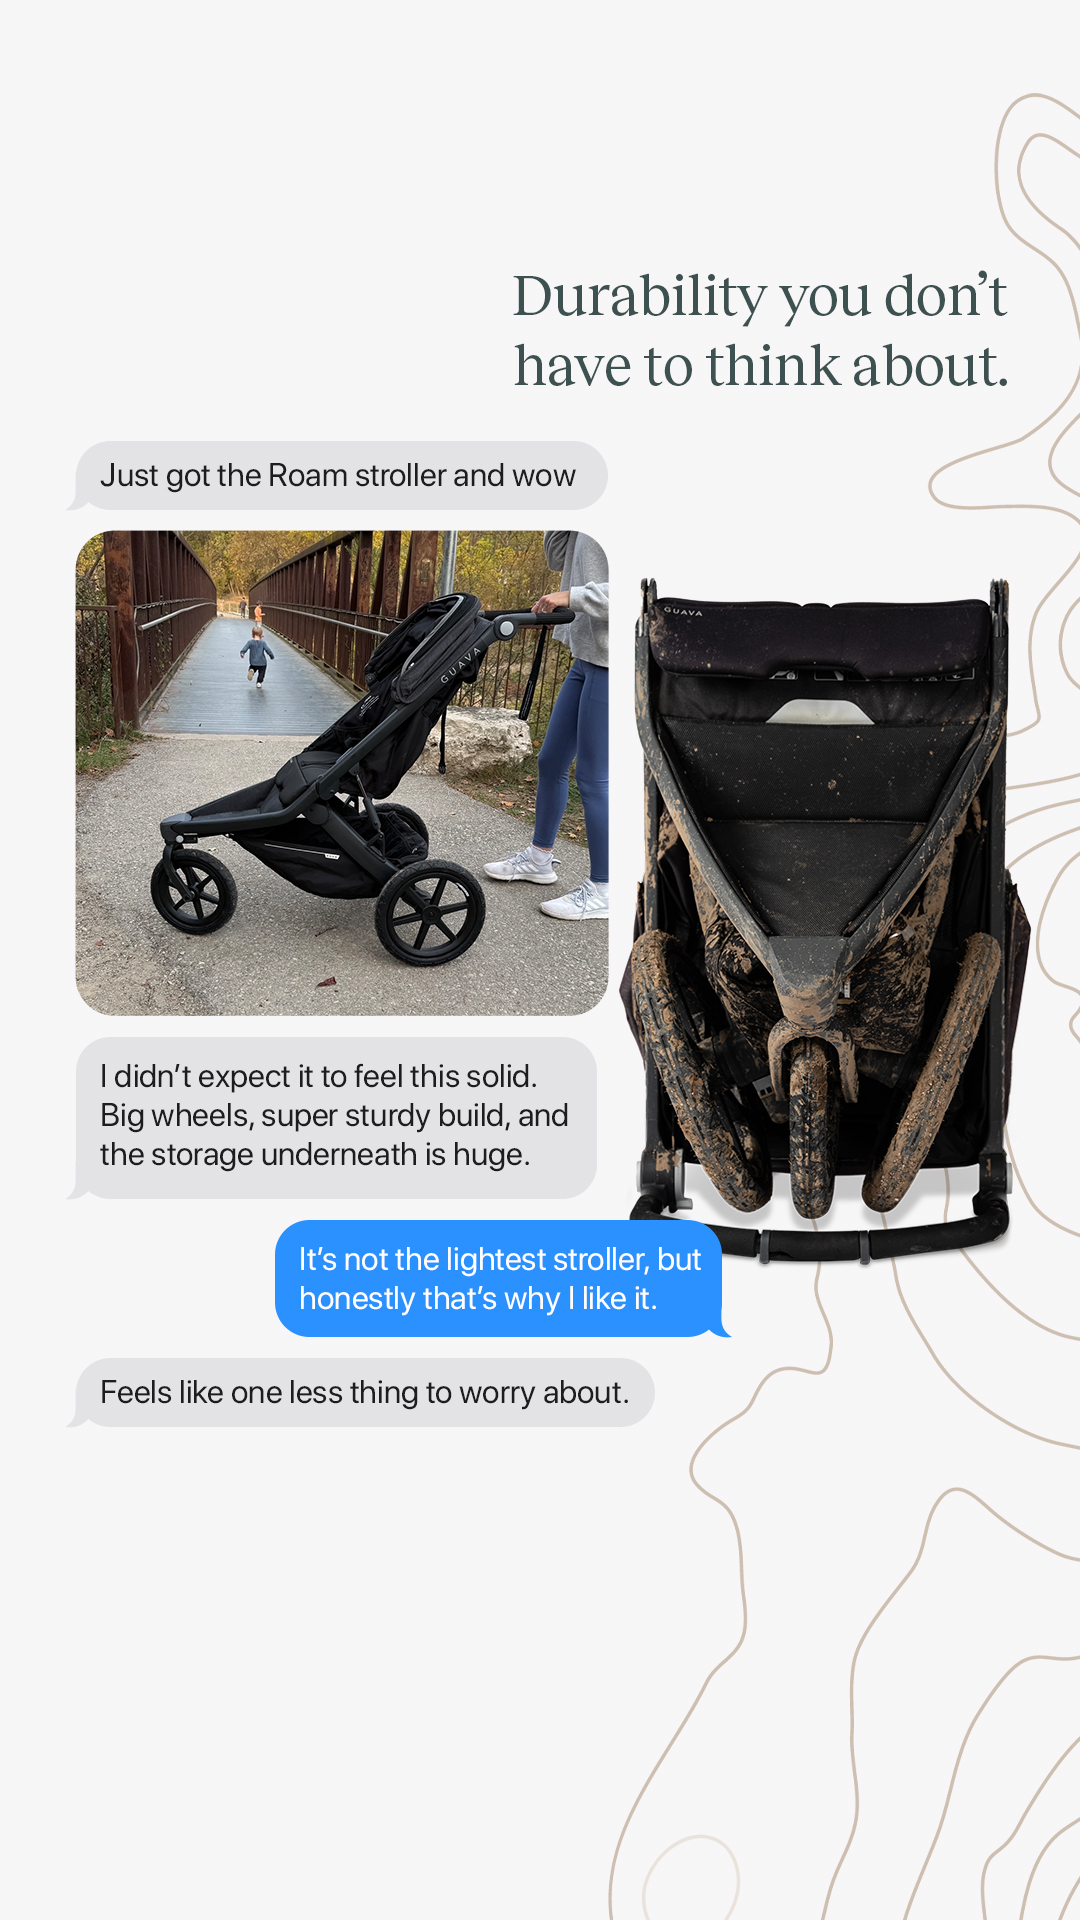
The whitespace is in the tail. Native-format angles that borrow a familiar interface do the pattern-interrupt work automatically. In our full 98,011: polaroid frame, 166 ads. Receipt parody, 42. Text-message screenshot, 19. Notes-app format, 7. Reddit-thread format, 7. Single-digit occupancy across a corpus this size is not a risk. It is an empty room.
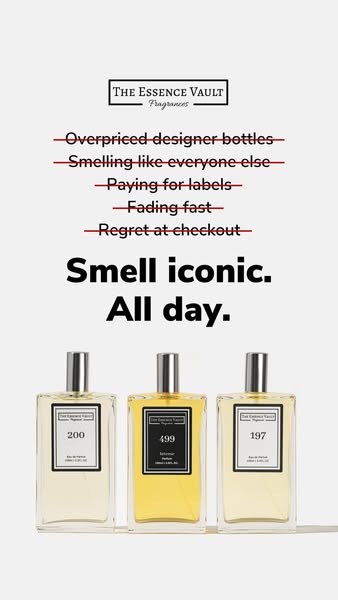
Here's what 500 DTC brands are running this week
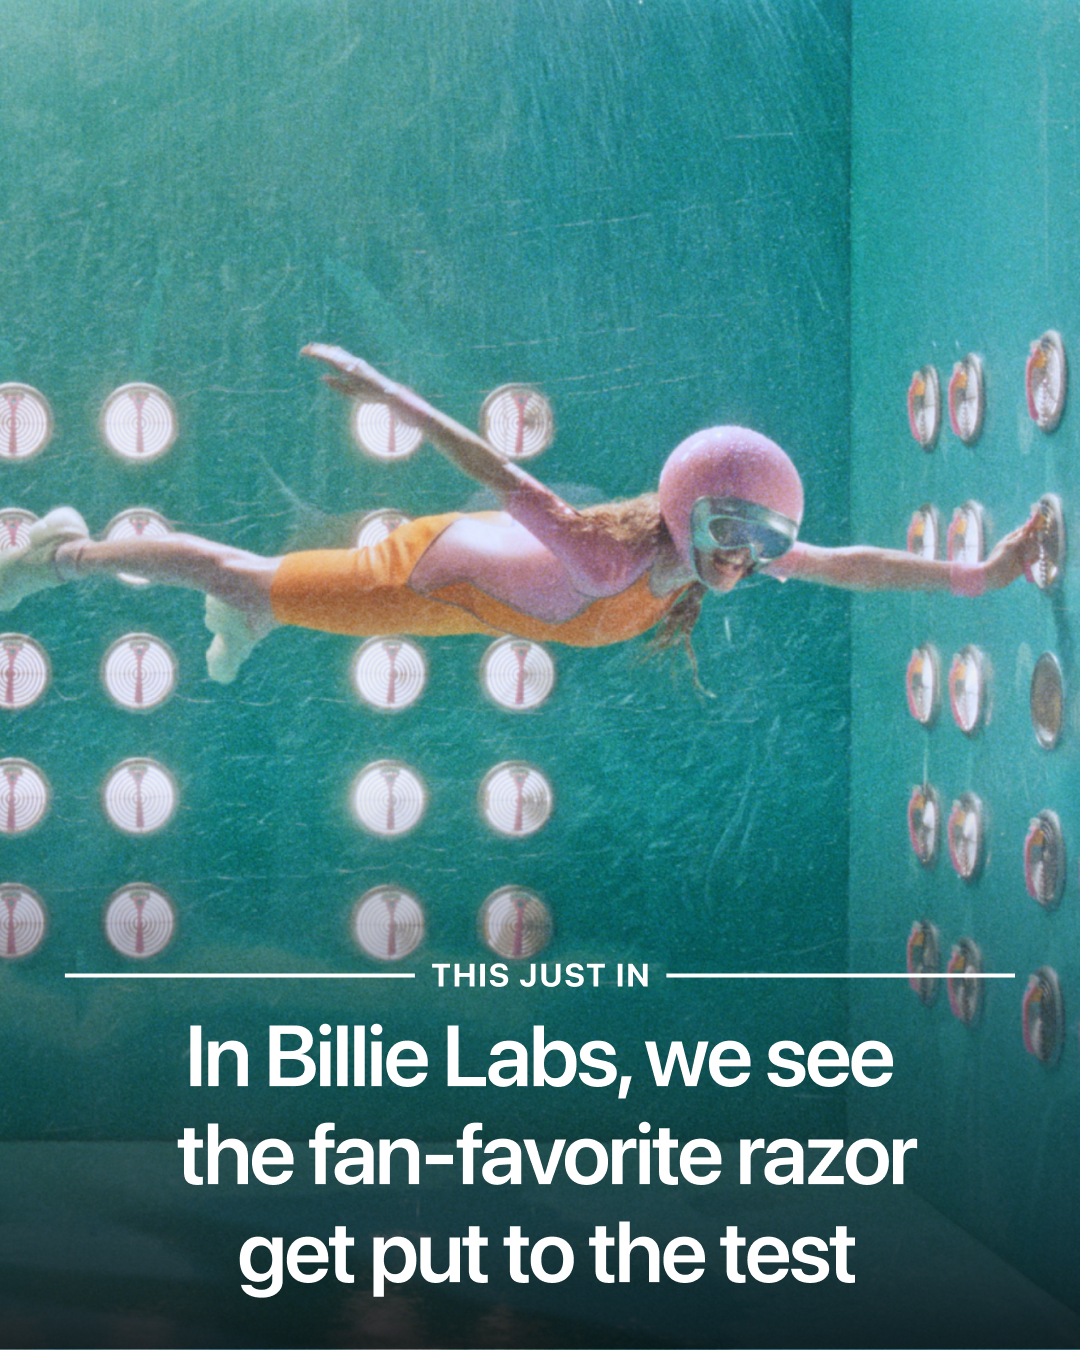
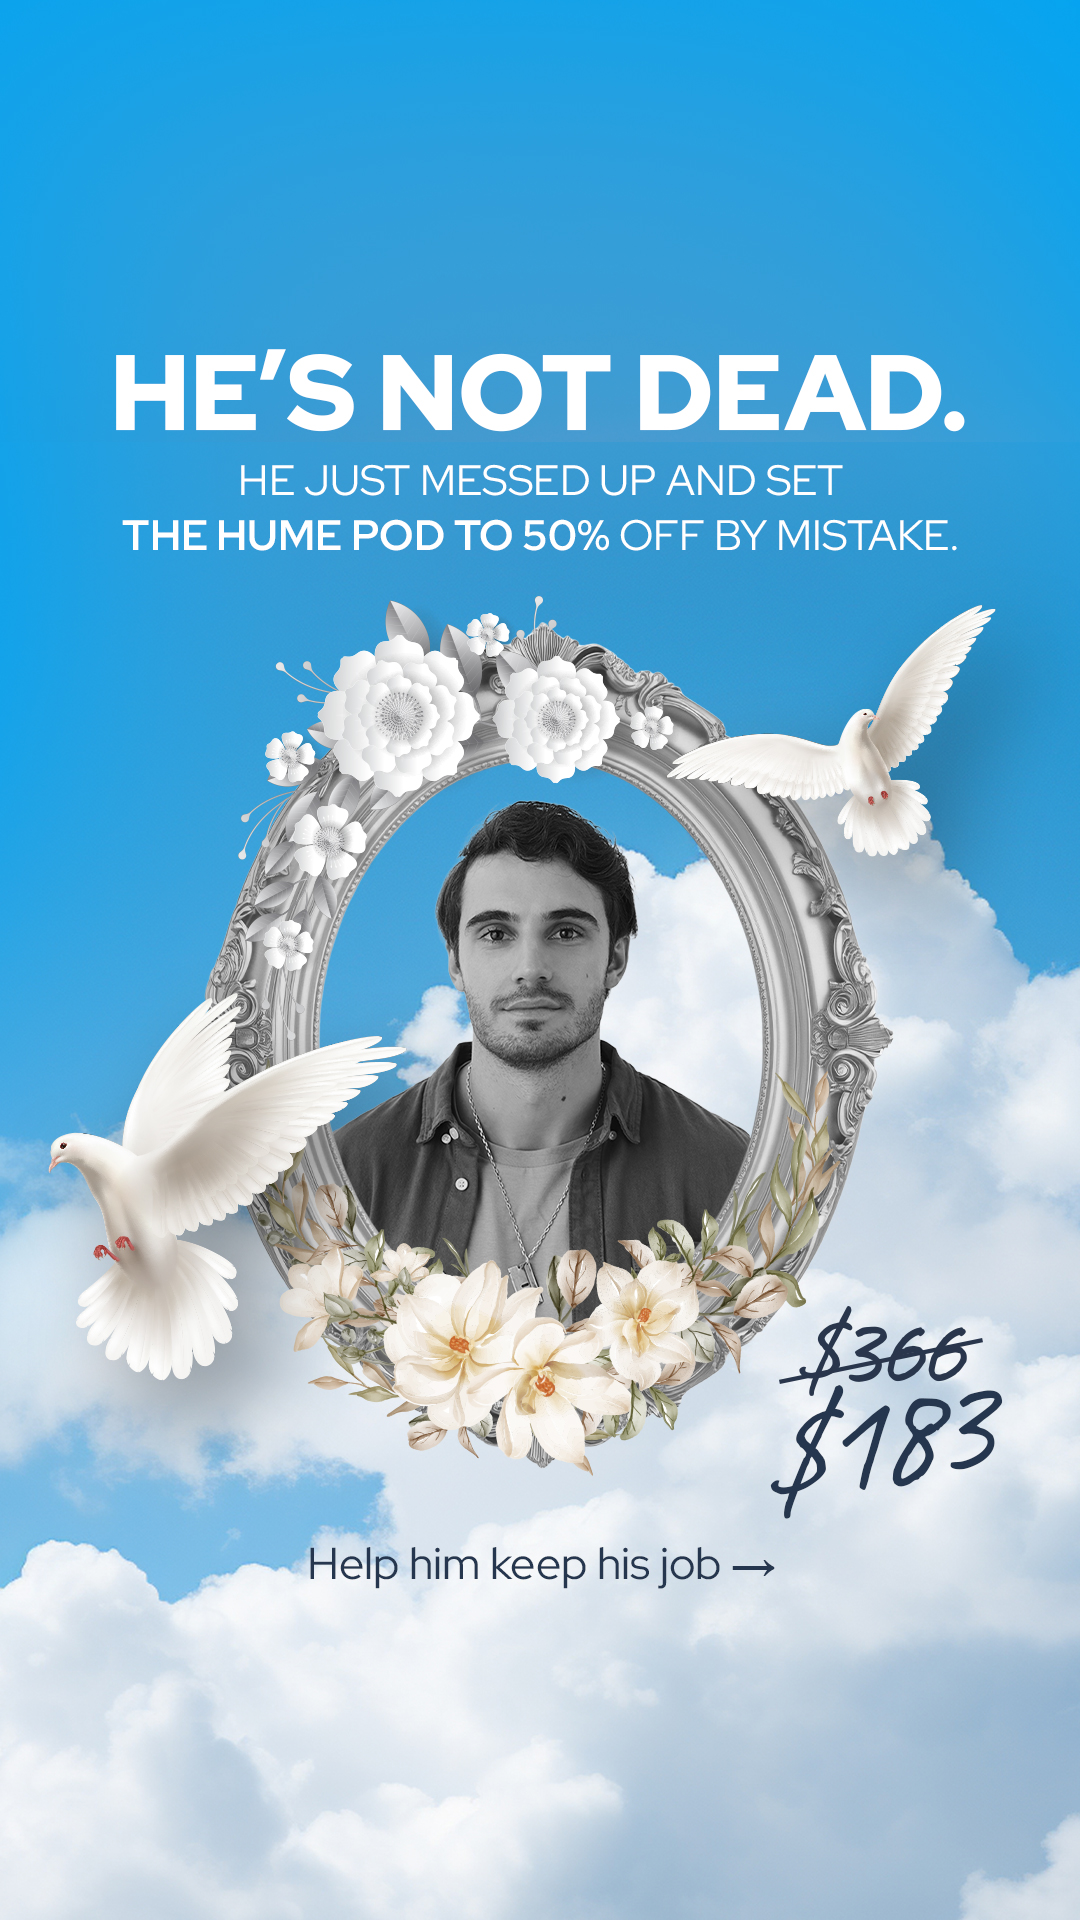
A small slice of the curated swipe file — every ad here is currently in market, hand-tagged by hook + angle. Open the full feed →


Video is not winning. The split is 52.5 to 47.5.
Every media buyer heard "video-first" this year. Every media buyer quietly kept shipping statics. The count says they were right.
52.5% static, 47.5% video, across 98,011 live ads. The universal number hides a twenty-point sector spread that makes the video-vs-static conversation almost useless if you strip out what you sell.
| Sector | % video | Video ads | Static ads |
|---|---|---|---|
| Food | 56% | 4,448 | 3,506 |
| Beauty | 54% | 6,956 | 5,818 |
| Wellness | 53% | 5,230 | 4,583 |
| Skincare | 52% | 3,721 | 3,408 |
| Home | 47% | 4,739 | 5,385 |
| Fitness | 46% | 2,470 | 2,877 |
| Accessories | 37% | 3,541 | 6,046 |
| Apparel | 36% | 6,209 | 11,128 |
Food and beauty push toward video because UGC and clinician endorsements are the working creative. Apparel and accessories stay static because product-hero and grid layouts do the job at a fraction of the cost. Whether video wins depends entirely on your category.
The median ad dies at eighteen days
18-day median. 62% never see day 30. 0.7% survive a year. This is why creative shops are shipping so much.
Ship two new ads a month and you are picking the winners a year in advance, blind, then hoping. Ship enough to keep a live-testing queue and roughly one in a hundred and forty will still be running at twelve months. That survivor is the account. Everything else is fuel.
Which is why the operational question is not "what should we test." It is "how many can we ship."
The one audit
One thing. This week.
Pull your last twenty ads. Read each one. Answer honestly: what argument is this ad actually making?
If more than half come back "it lists three benefits," you are inside the 68%. Meta is reading your account as identical to every other benefit-stack advertiser in your sector.
A new template will not fix that. A different argument will.
Swap-this-for-that. A real before-and-after timeline with dates. A science explainer with the mechanism drawn. An actual side-by-side. A receipt parody. A text-thread ad. A polaroid. Fifty seats. Forty-eight are open.
The angle filter, ready-made. Every ad in our curated swipe file is hand-tagged on hook and angle. Toggle "Distinctive only" and you see the ~15% of the feed not running the default benefit-stack argument. That is the reference set for planning your next angle test. 2,025 brands tracked, updated daily. Free tier, no signup. Open the swipe file →